Understanding Your Statistics
Learn to read charts and gain insights from your vehicle data
Prerequisites
- At least 2 refuels recorded
In this series (5 parts)
After recording a few refuels and expenses, My Cars generates detailed statistics and charts. This guide helps you understand and use them.
Dashboard Overview
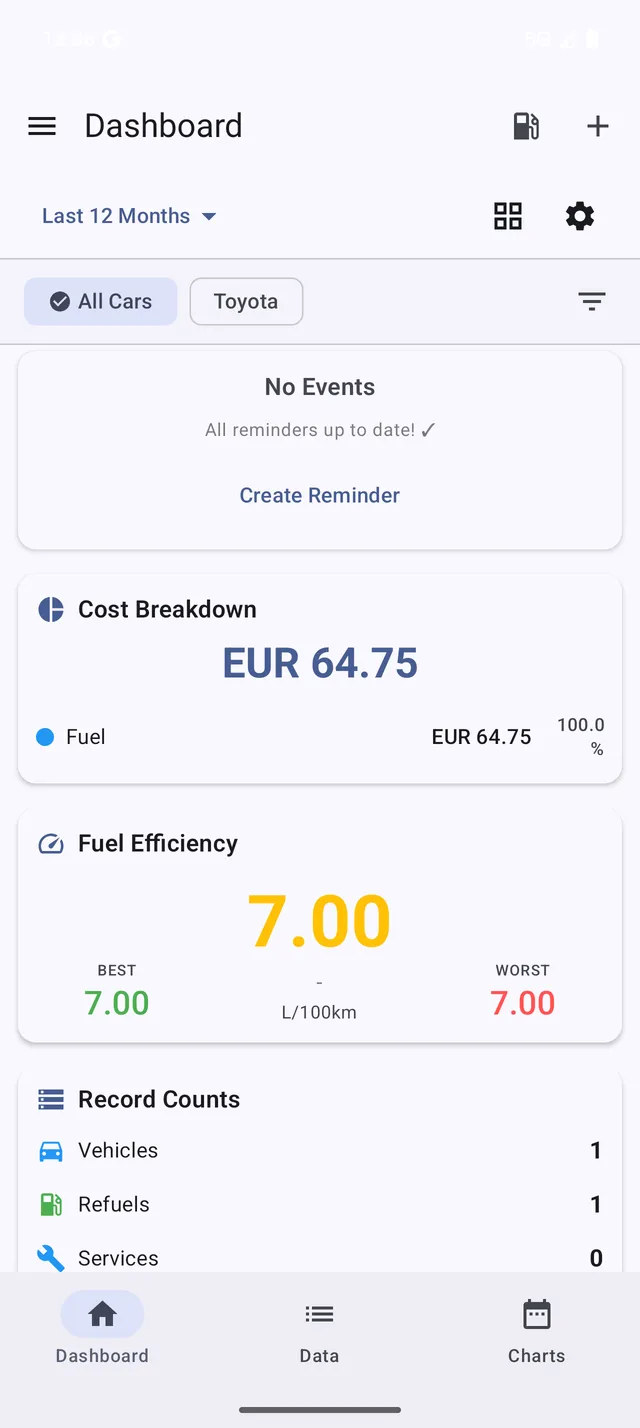 The dashboard displays your fuel efficiency, costs, and distance at a glance
The Dashboard shows key metrics at a glance:
- Fuel Efficiency - Your average consumption
- Total Costs - Expenses over the selected period
- Distance Driven - Total kilometers/miles
- Cost per Distance - How much each km/mile costs
Tap any card to see more details.
Charts
Access charts from Menu > Charts or the Dashboard. Available charts include:
Fuel Charts
- Fuel Efficiency Over Time - See trends and patterns
- Fuel Cost Over Time - Track spending
- Fuel Price History - Monitor price changes
- Cost per Distance - Running cost analysis
Expense Charts
- Expenses by Category - Where your money goes
- Monthly Expenses - Spending over time
- Annual Comparison - Year-over-year view
Vehicle Charts
- Depreciation - Estimated value over time
- Total Cost of Ownership - All-in cost analysis
Tip: Tap on chart elements to see exact values.
Reading Your Fuel Efficiency
The fuel efficiency chart shows your consumption over time:
- Higher values (if using L/100km) = less efficient
- Lower values (if using MPG) = less efficient
- Look for patterns: city driving vs highway, seasons, driving style
Common influences on efficiency:
- Traffic conditions
- Weather and temperature
- Air conditioning use
- Tire pressure
- Driving style
- Vehicle load
Insights (PRO+)
With a PRO+ subscription, the app provides intelligent insights:
- Unusual Consumption - Alerts when efficiency drops significantly
- Maintenance Reminders - Based on your patterns
- Cost Predictions - Forecast future expenses
- Efficiency Tips - Personalized recommendations
Access insights from the Dashboard or Menu > Insights.
Filtering Data
Most screens let you filter by:
- Date Range - Last month, last year, custom range
- Vehicle - One vehicle or all
- Category - Specific expense types
Use filters to focus on what matters to you.
Exporting Statistics (PRO)
With a PRO subscription, export your data:
- Go to Menu > Export
- Choose format (CSV or PDF)
- Select date range
- Share or save the file
Useful for:
- Tax reporting
- Business expense claims
- Personal records
Next Steps
Your data is valuable - let’s set up backup to protect it.